Gold Price Forecast: XAU/USD bulls coming up for air into critical daily structures
- Gold bulls move in on a critical technical area on the daily chart.
- US data sink the US dollar further in a weaker US yield environment.
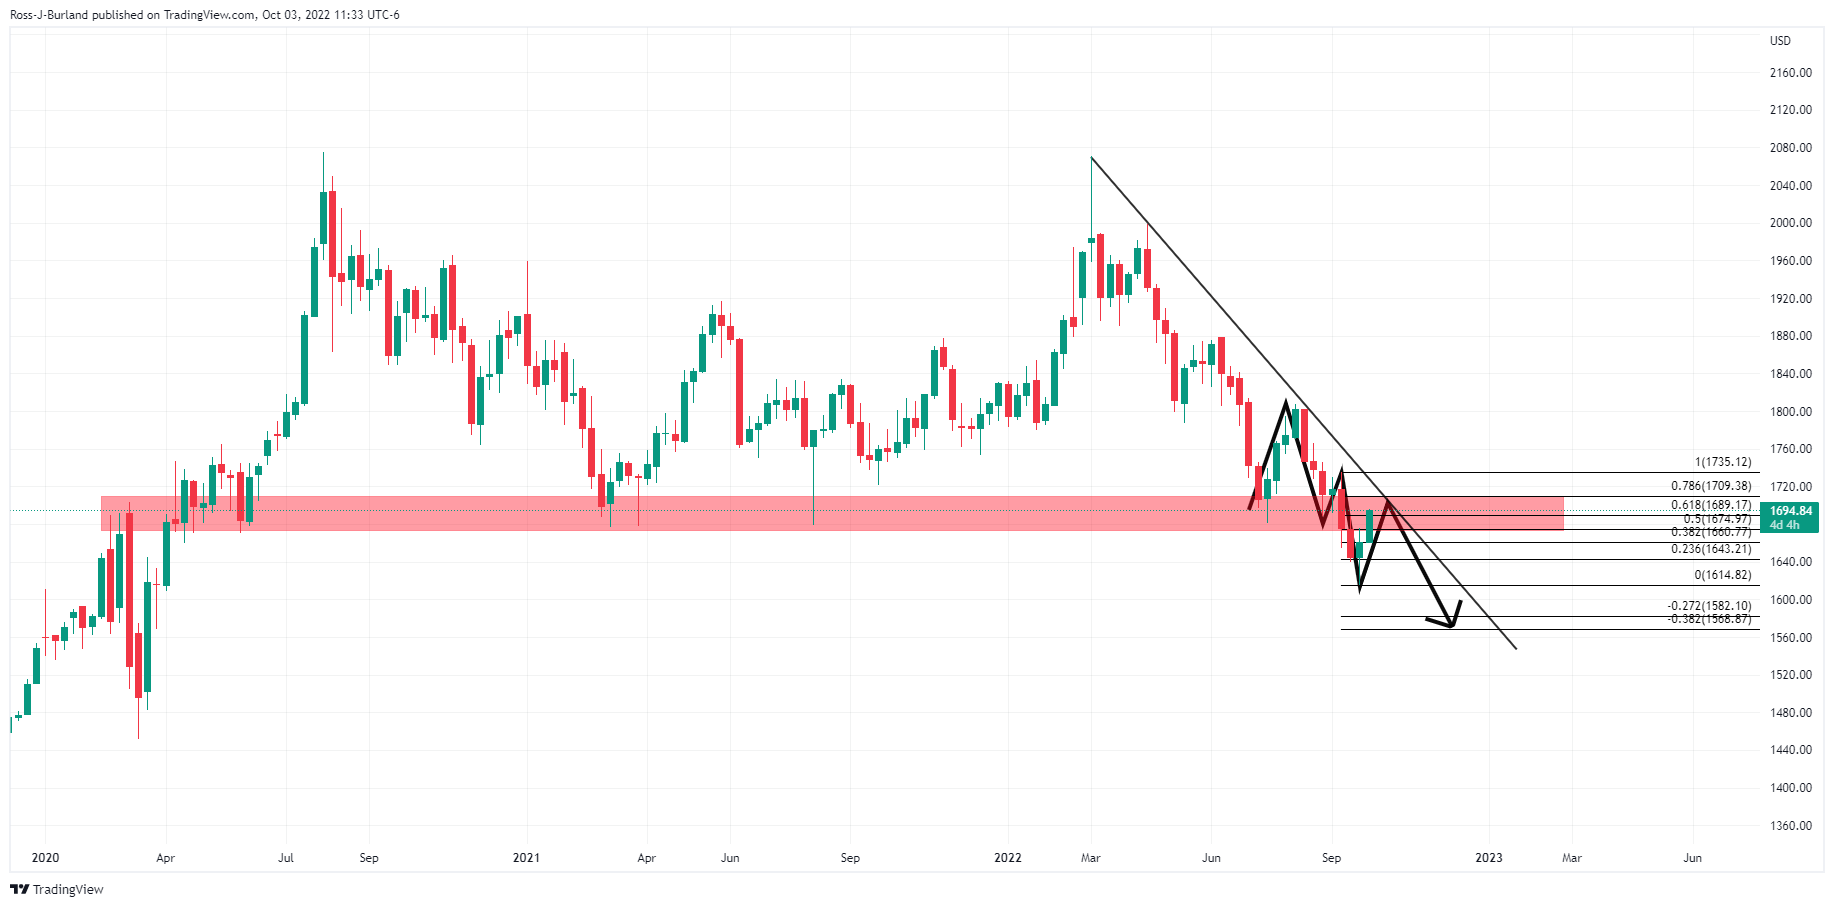
The gold price exploded in the New York trade around the disappointment in the US data. Gold has travelled between a low of $1,696.26 and $1,697.13 and is higher by some 2.13% on the day. The price is homing in on a 78.6% Fibonacci retracement on the daily chart, as illustrated below having already breached the golden 61.8% ratio in trade today.
US data missed expectations despite a September beat in S&P Global Manufacturing PMI. The Institute for Supply Management’s (ISM) Manufacturing Purchasing Managers Index (PMI) arrived at 50.9 vs 52.2 expected and the prior 52.5 which was the catalyst for the sell-off in the greenback that was already being weighed by softer US yields. Boosting safe-haven demand for metals, U.S. manufacturing activity grew at its slowest pace in nearly 2-1/2 years in September. In turn, gold shot through resistance triggering stops along the way no doubt, exuberating a move into 270 pips to the highs of the day.
The US dollar has eased, helping demand for the greenback-priced bullion among overseas buyers. DXY, an index that measures the greenback vs. a basket of currencies is now down some 0.2% after falling from a high of 112.543 to a low of 111.470. This softness in the safe-haven currency has afforded gold some respite that has staged a mini-recovery after dropping to its lowest since April 2020 on Sept. 28. The benchmark US 10-year Treasury yields have also fallen and are now making an advance on key support structure:
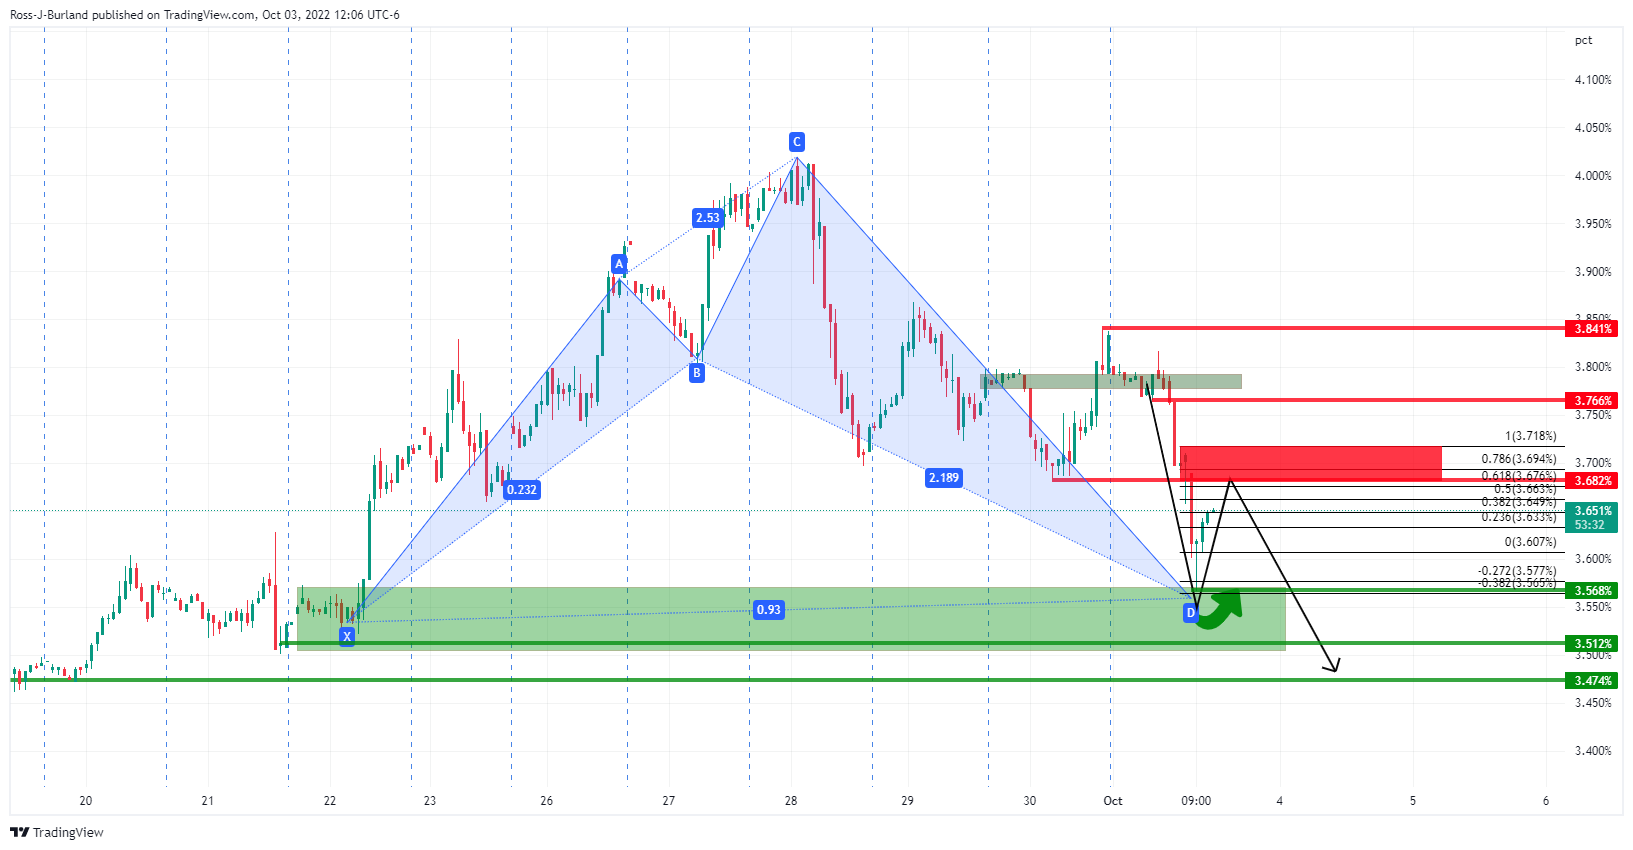
This is supporting the demand for zero-yield gold.
However, analysts at TD Securities argue that ''gold prices remain in a strengthening downtrend, despite the recent respite afforded by the slump in USD. The risk of capitulation remains prevalent for the yellow metal moving into October, with strong data continuing to point to a more aggressive Fed rate path ahead.''
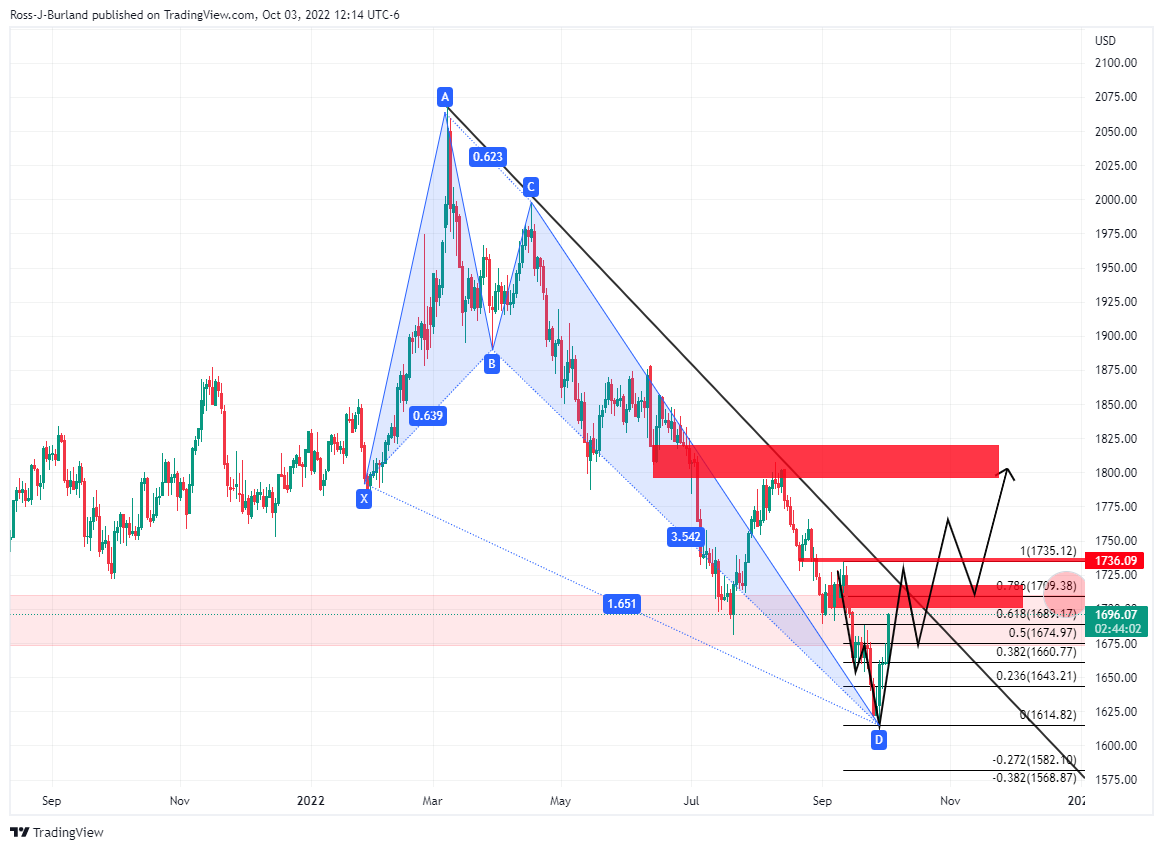
Gold technical analysis
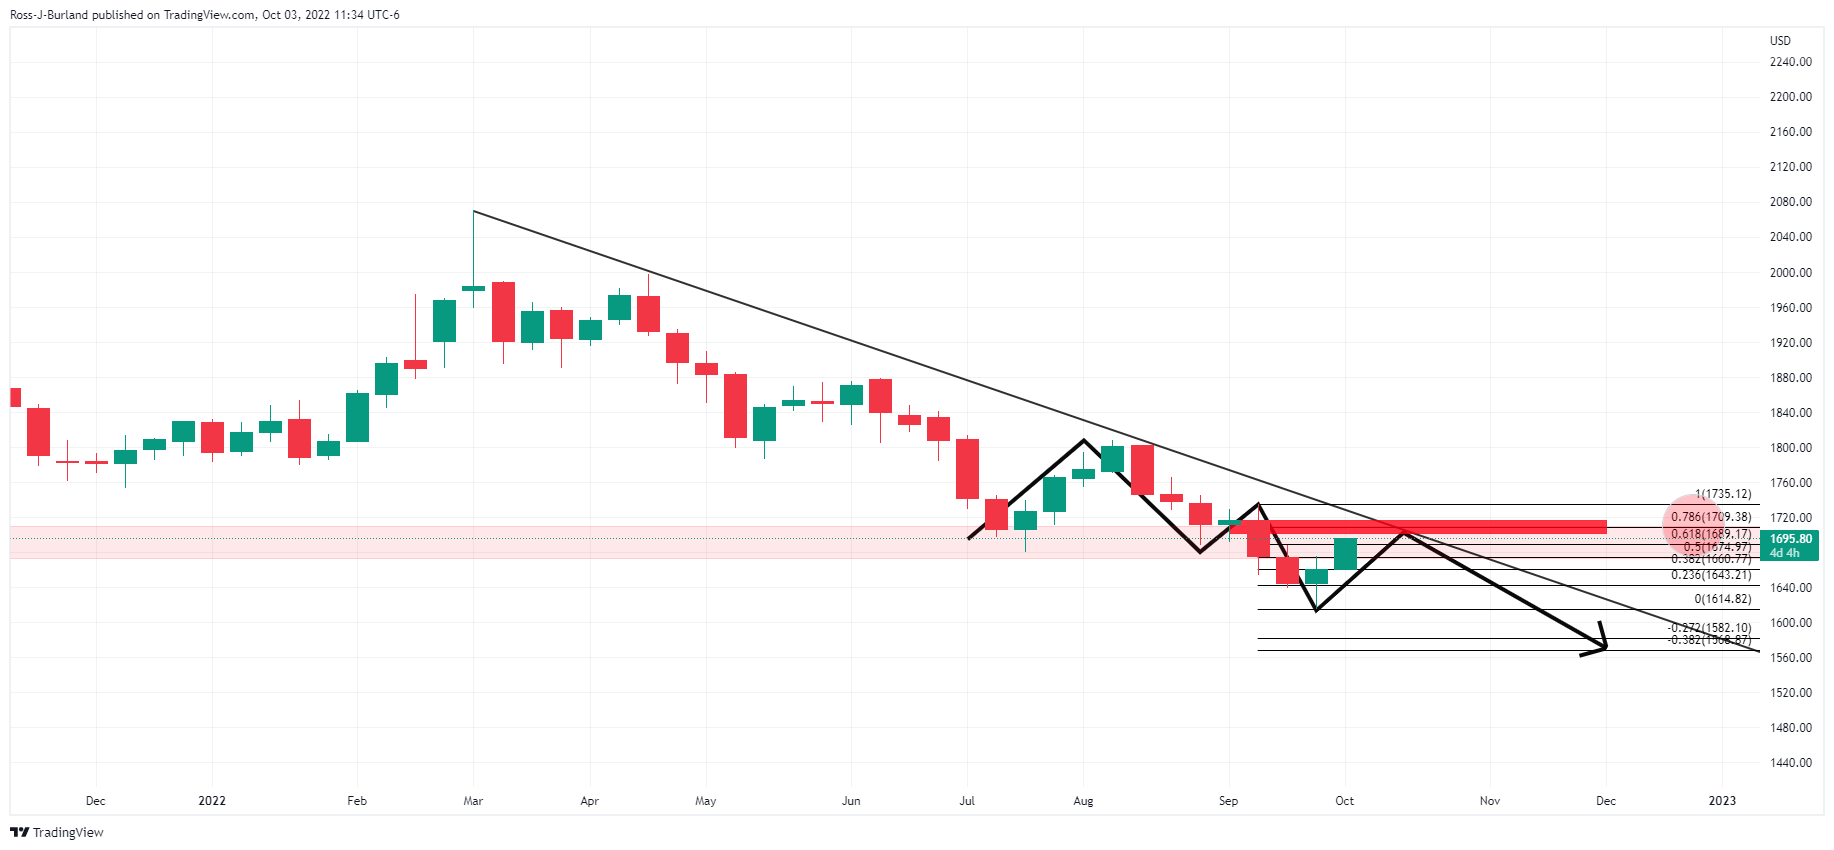
The daily charts above illustrate the price's trajectory below trendline resistance, on the way to the 78.6% Fibonacci retracement level near $1,710/oz. If resistance holds, then the price would be expected to continue with its southerly trajectory. On the other hand, should the bulls stay committed, then a break of resistance structure could lead to a significant upside continuation as per the bullish harmonic crab pattern: