US Dollar Index Price Analysis: DXY bulls lurk around 95.70
- DXY struggles to extend pullback from 16-month high, sidelined of late.
- 50-HMA, one-week-old support line restricts immediate downside.
- Steady RSI hints at smooth sailing for the bulls.
US Dollar Index (DXY) remains indecisive around 95.78 during early Thursday, following the pullback from a 16-month high to post the heaviest daily loss in over a week.
Although overbought RSI conditions dragged the greenback gauge from a multi-day high, a convergence of the 50-HMA and an ascending trend line from November 09 offers a tough nut to crack to the intraday bears. Also rejecting the bearish bias is the recently steady RSI line.
Should the DXY sellers ignore the aforementioned catalysts and break the 95.70 support convergence, a fall to Friday’s top surrounding 95.25 becomes imminent.
Following that November 11 swing low near 94.85 will be crucial to open gates for the US Dollar Index south run.
Meanwhile, recent highs near the 96.00 threshold precede the multi-day peak of 96.24 to limit the DXY’s short-term upside.
Should the quote manage to jump past 96.25, lows marked during late 2019 around 96.35 will be in focus.
DXY: Hourly chart
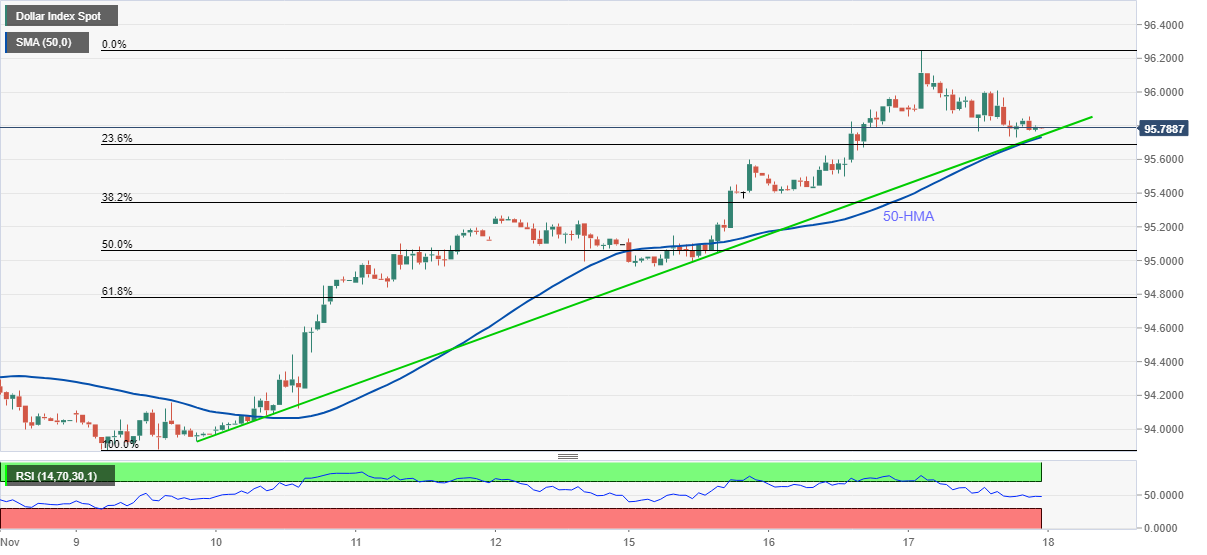
Trend: Bullish