EUR/JPY Price Analysis: A bullish flag in the daily chart could propel the pair towards 134.00
- Euro pares Tuesday’s losses, as mild risk-on market sentiment weighs on the Japanese yen.
- Safe-haven currencies like the Japanese yen and the US dollar are down, while the outlier is the Swiss franc rising.
- EUR/JPY: Bullish flag in the daily chart could propel the cross-currency pair towards 134.00.
The EUR/JPY trims some of Tuesday’s losses and advances 0.12%, trading at 132.08 during the New York session at the time of writing. The market’s mood is mixed, but on the FX market, it is slightly tilted risk-on, as the Japanese yen and the US dollar fall, except for the Swiss franc, which advances against most G8 currencies.
During the Asian session, the pair was sharply down around 131.50. Once the European session kicked in, buying pressure sent the EUR/JPY rallying towards 132.17. However, the upside move was capped around those levels, as traders seem to prepare for the Federal Reserve monetary policy statement.
EUR/JPY Price Forecast: Technical outlook
Daily chart
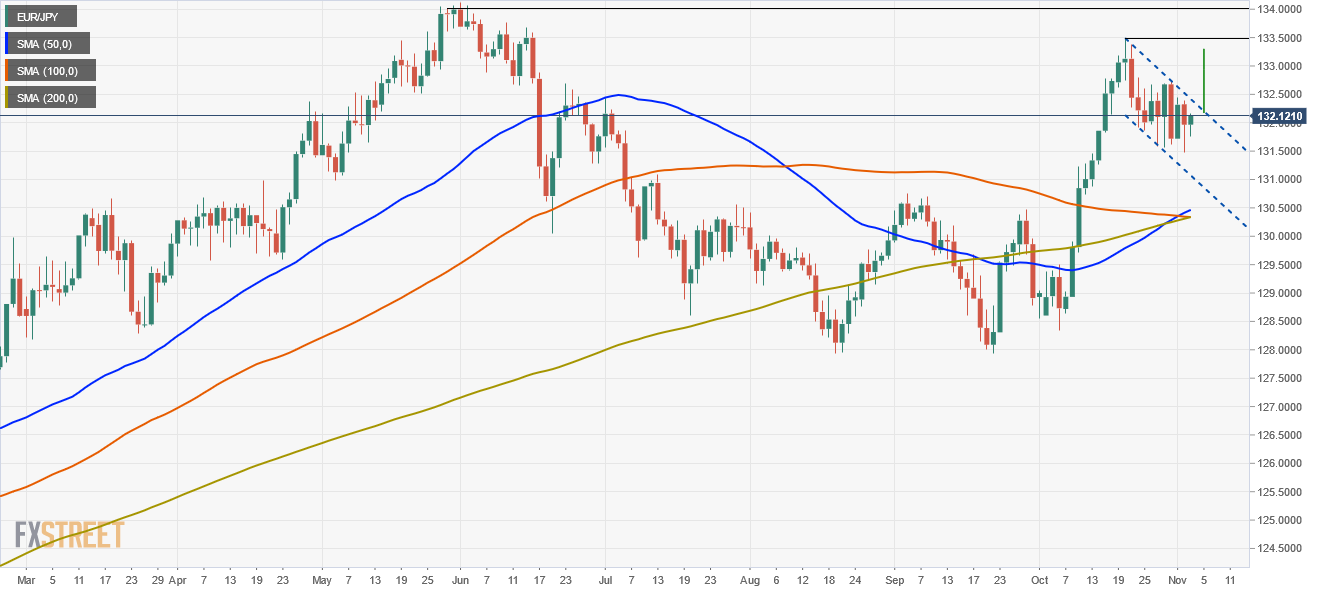
The EUR/JPY daily chart shows that the pair has an upward bias. The daily moving averages (DMA’s) are well below the spot price, with the 200-day moving average below the shortest time frames but flattish. The cross-currency seems to be forming a bullish flag, indicating that the pair has upside, but a break above the top of the bullish flag, around 132.90, is required to confirm its validity.
In the case of that outcome, the final target of the upside move would be 134.00, but it would find some hurdles on the way north. The first resistance would be 133.00, followed by a downslope trendline that travels from June 1 high towards October 20 high, around the 133.40-60 area.
The Relative Strength Index (RSI) at 56, flattish, indicates the pair could print another leg-up before reaching overbought levels.