USD/CNH Price Analysis: Weekly falling channel, 50-HMA probe bounce off multi-month low
- USD/CNH eases from intraday high but snaps three-day downtrend near May 2018 levels flashed the previous day.
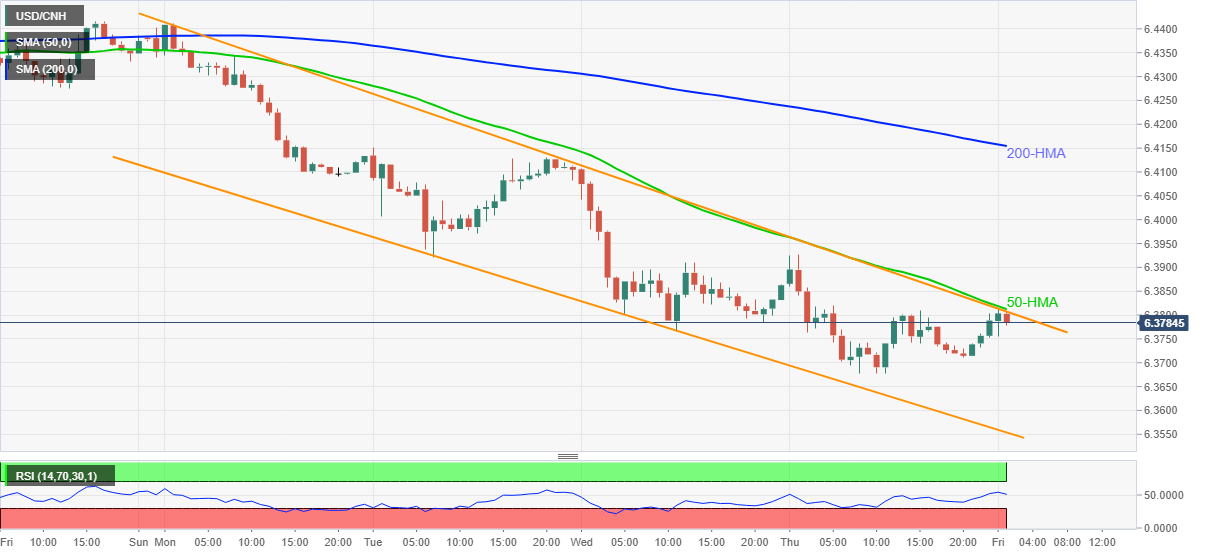
- Upbeat RSI suggests further consolidation of losses, 200-HMA offers extra resistance.
USD/CNH struggles to keep the intraday gains around 6.3800, up 0.13% on a day, during its first positive daily performance on Friday. The Chinese currency pair dropped to the lowest since May 2018 before bouncing off the 6.3678 level.
However, the corrective pullback battles 50-HMA and resistance line of the one-week-old descending trend channel, around 6.3815. Though, strong RSI backs the pair buyers to cross the nearby key hurdle.
Even so, the weekly top surrounding 6.4130 and 200-HMA near 6.4155 could test the USD/CNH bulls before offering a pass to enter.
On the contrary, 6.3700 and the recent low, also the multi-month bottom, near 6.3675, may entertain intraday sellers ahead of challenging them with the stated channel’s support line, close to 6.3550.
It should be noted that the USD/CNH failures to bounce off 6.3550 makes it vulnerable to revisit the late 2015 double-bottoms around 6.3150.
USD/CNH hourly chart
Trend: Pullback expected