Gold Price Analysis: Risks remain titled to the upside amid healthy supports – Confluence Detector
After settling last week higher around $1810, Gold is on the defensive starting out a fresh week. The risks, however, remain skewed to the upside with healthy support levels stacked up to limit any pullbacks.
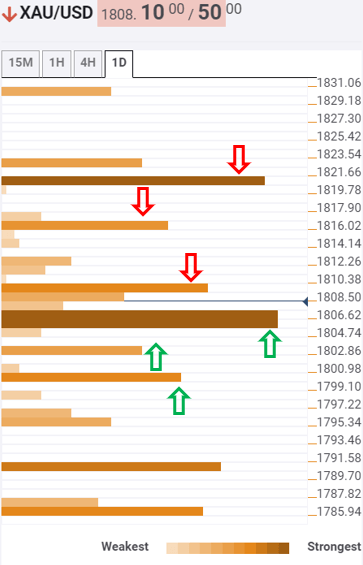
According to the Technical Confluences Indicator, the bright metal needs a decisive break the powerful supports around $1805 to reverse the near-term uptrend. That level is the confluence of the Fibonacci 38.2% one-week, one-day, SMA50 4H, SMA5 one-day and SMA100 one-hour.
The next support awaits at $1802, the intersection of the SMA10 one-day and Fibonacci 61.8% one day. Sellers will then look for the downside target at $1800, where the Fibonacci 61.8% one-week and pivot point one-day S1 coincide.
To the upside, the immediate resistance is aligned at $1809.50, the convergence of the Fibonacci 23.6% one-week, SMA5 four-hour and previous high one-hour.
Acceptance above the latter will see doors opening towards $1816, where the previous week high and pivot point one-day R1 meet.
Buying pressure will likely accelerate on a break above the aforesaid barrier, with the critical $1820 level back in sight. That level is the confluence of the pivot point one-week R1 and pivot point one-month R1.
Here is how it looks on the tool

Confluence Detector
The Confluence Detector finds exciting opportunities using Technical Confluences. The TC is a tool to locate and point out those price levels where there is a congestion of indicators, moving averages, Fibonacci levels, Pivot Points, etc. Knowing where these congestion points are located is very useful for the trader, and can be used as a basis for different strategies.
This tool assigns a certain amount of “weight” to each indicator, and this “weight” can influence adjacents price levels. These weightings mean that one price level without any indicator or moving average but under the influence of two “strongly weighted” levels accumulate more resistance than their neighbors. In these cases, the tool signals resistance in apparently empty areas.
Learn more about Technical Confluence
