Gold Price Analysis: Pulls back amid overbought RSI, multiple upside barriers ahead
- Gold prices step back from the multi-month top.
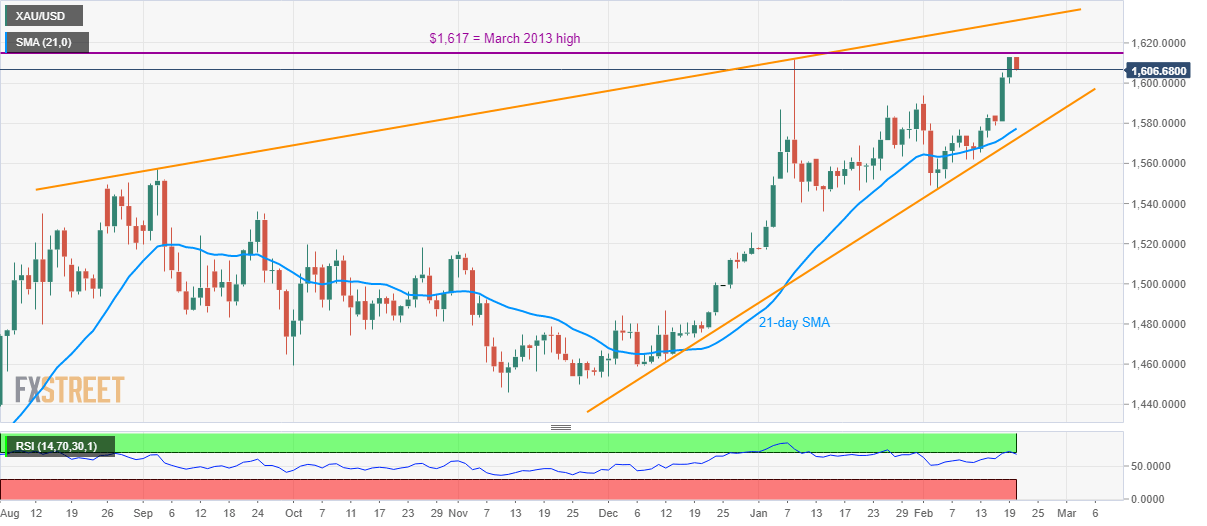
- Early-month high acts as the immediate support, March 2013 top offers nearby resistance.
- A downside break of $1,572 will confirm broad bearish formation.
Gold prices decline to $1,606 during the early Thursday. The yellow metal surged to the highest since March 2013 the previous day but failed to hold onto gains due to the overbought RSI conditions.
As a result, sellers are now awaiting a downside break of $1,600 to aim for the early-month high nearing $1,594.
However, 21-day SMA and an upward sloping trend line from December 2019, around $1,577 and $1,572 respectively, will limit the bullion’s further declines.
It should be noted that the precious metal’s downside past-$1,572 will confirm a broad bearish rising wedge formation and can trigger a fresh down-leg towards the late-2019 area.
On the upside, March 2013 high near $1,617 acts as the immediate resistance ahead of the rising trendline connecting highs marked during September 20119 and January 2020, close to $1630/31.
Gold daily chart
Trend: Pullback expected