Gold Price Analysis: Short-term ascending triangle keeps bears hopeful
- Gold remains below $1560/62 area since late-January 08.
- Four-day-old rising trend line limits immediate declines.
- A lack of momentum seems to trouble traders.
Gold prices seesaw around $1,558 during early Monday. The yellow metal recently took a U-turn from multi-day-old horizontal resistance but is still trading inside the short-term rising triangle. Also, RSI and MACD are troubling traders while portraying no major momentum.
However, multiple pullbacks from $1,560/62, coupled with broad US dollar strength, keep the odds of the bullion’s declines.
With this, sellers’ will look for a clear break of $1,555 to aim for the mid-month low surrounding $1,547 and the monthly bottom near $1,543 during further declines.
Alternatively, buyers could sneak in if the quote rallies successfully beyond $1,562. In doing so, 50% and 61.8% Fibonacci retracements of the declines from January 08 to January 15, at $1,573 and $1,582 respectively, will please the bulls.
Gold four-hour chart
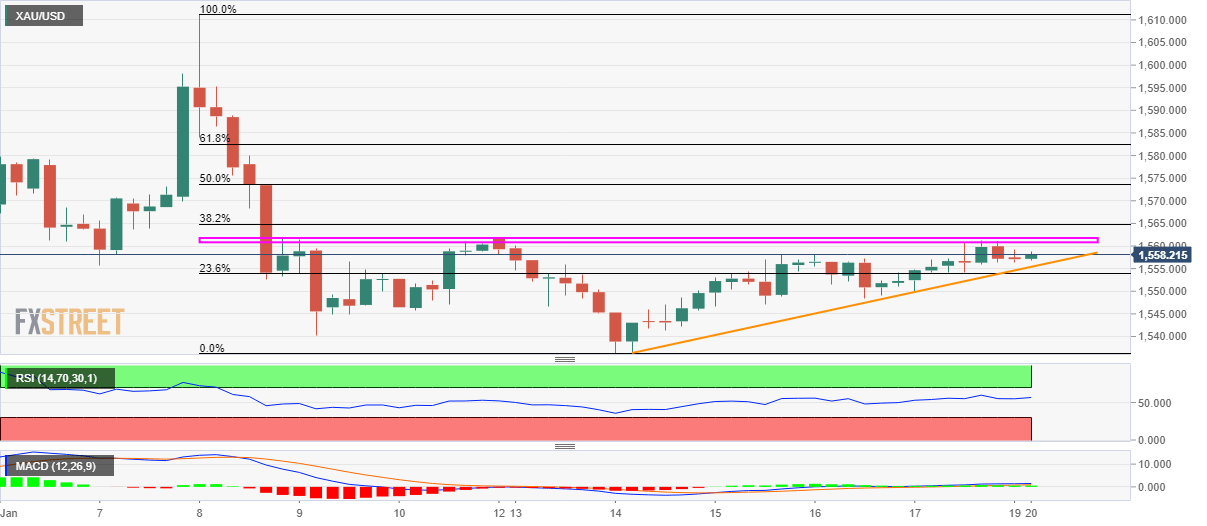
Trend: Sideways