Back
2 Jan 2020
AUD/JPY Technical Analysis: Bounces off 10-day SMA, three-week-old trendline
- AUD/JPY recovers from near-term key support confluence.
- Monday’s high could lure buyers while 200-day SMA holds the key to further declines.
- Bullish MACD, sustained trading beyond key support signal further upside.
AUD/JPY takes the bids to 76.23 during early Thursday morning in Asia. The pair recently bounced off 10-day SMA and an upward sloping trend line since December 10.
In addition to the pair’s U-turn from near-term key support confluence, around 76.00-75.90 now, bullish MACD also increases the odds for the pair’s further upside. In doing so, December 27 high of 76.60 will become immediate resistance to watch.
Should AUD/JPY prices manage to stay positive beyond 76.60, 77.00 round-figure and March month low near 77.55 will be on the Bull’s radar.
On the contrary, a downside break below 75.90 can’t be considered as a sell signal unless the quote slips below a 200-day SMA level of 75.00.
AUD/JPY daily chart
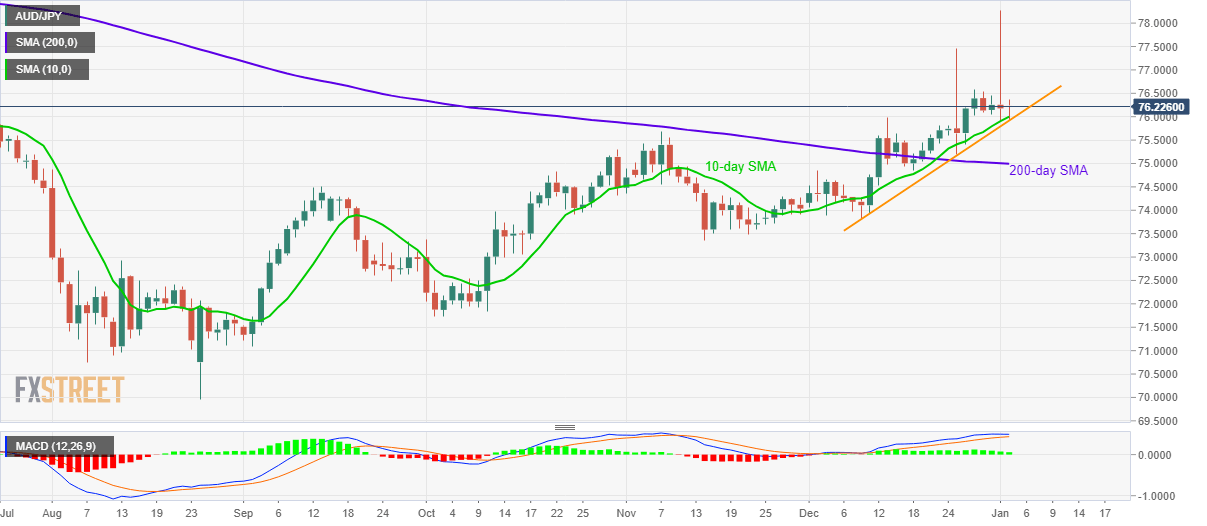
Trend: Bullish