Back
29 Nov 2019
EUR/USD Technical Analysis: Euro bulls getting a good deal on Black Friday
- EUR/USD surprises with a bullish turnaround after a failed breakdown below the 1.1000 handle.
- Resistance is seen at the 1.1035 price level.
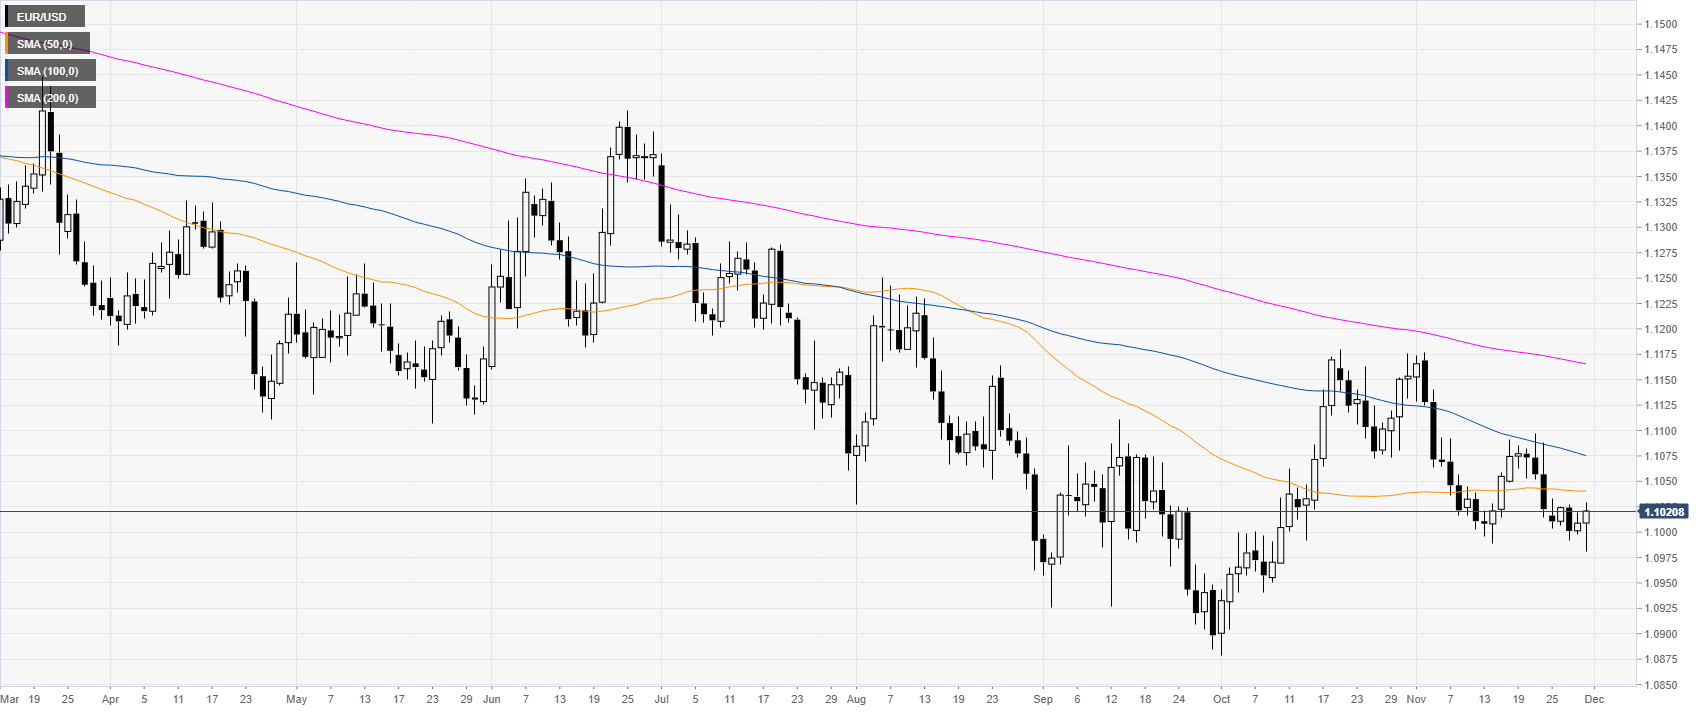
EUR/USD daily chart
The euro/dollar currency pair, on the daily time frame, is trading in a downtrend below the main daily simple moving averages (DMAs). This Friday, on an intraday basis, the market dropped to six-week lows but the bulls stepped in lifted the pair back above the 1.1000 handle.
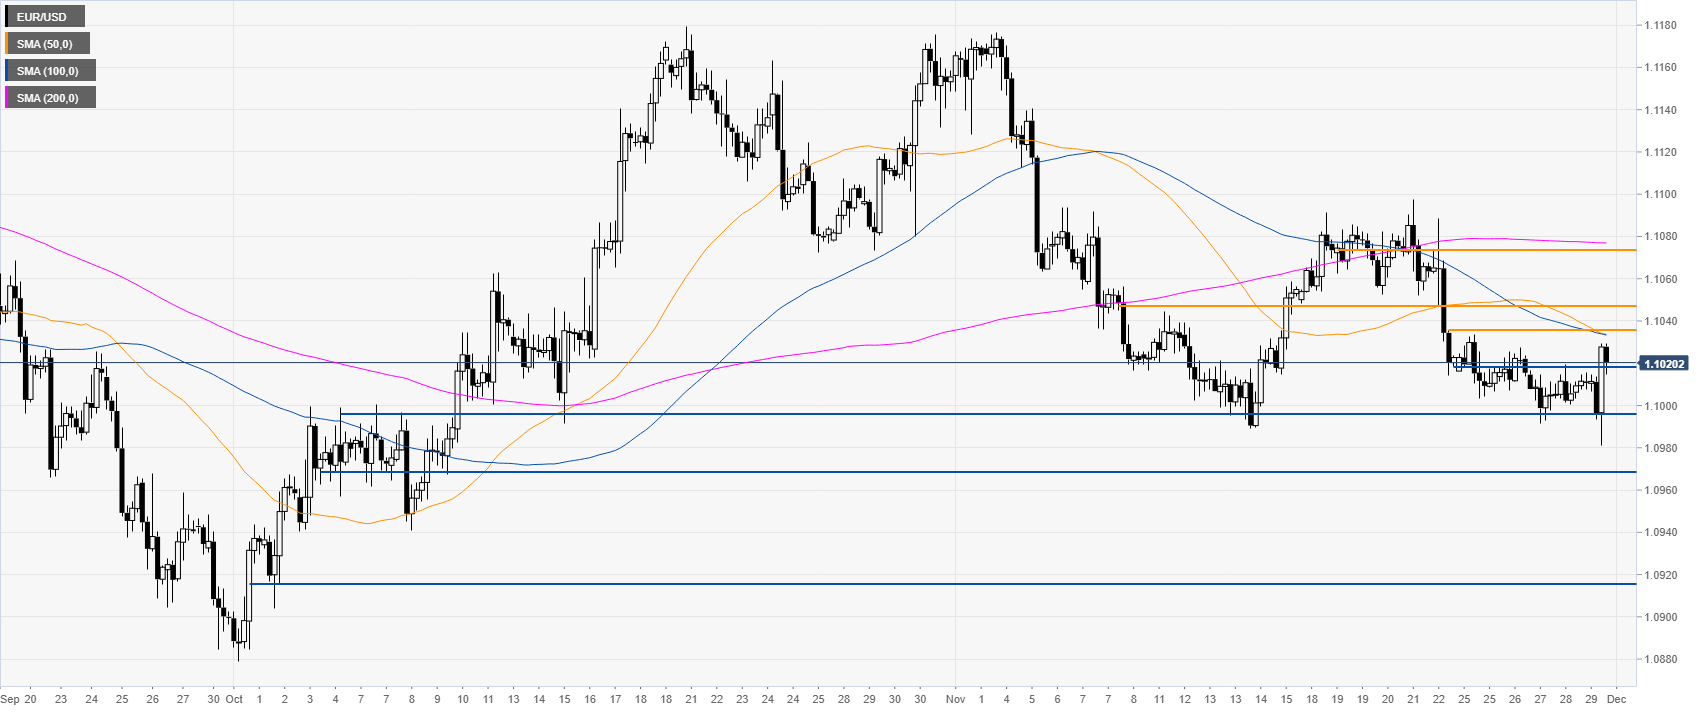
EUR/USD four-hour chart
EUR/USD formed a double bottom in November near the 1.1000 handle and rose above the 1.1020 resistance becoming now support. If the bulls can break 1.1035 resistance, the market is set to climb towards the 1.1047 and 1.1075 price levels, according to the Technical Confluences Indicator.
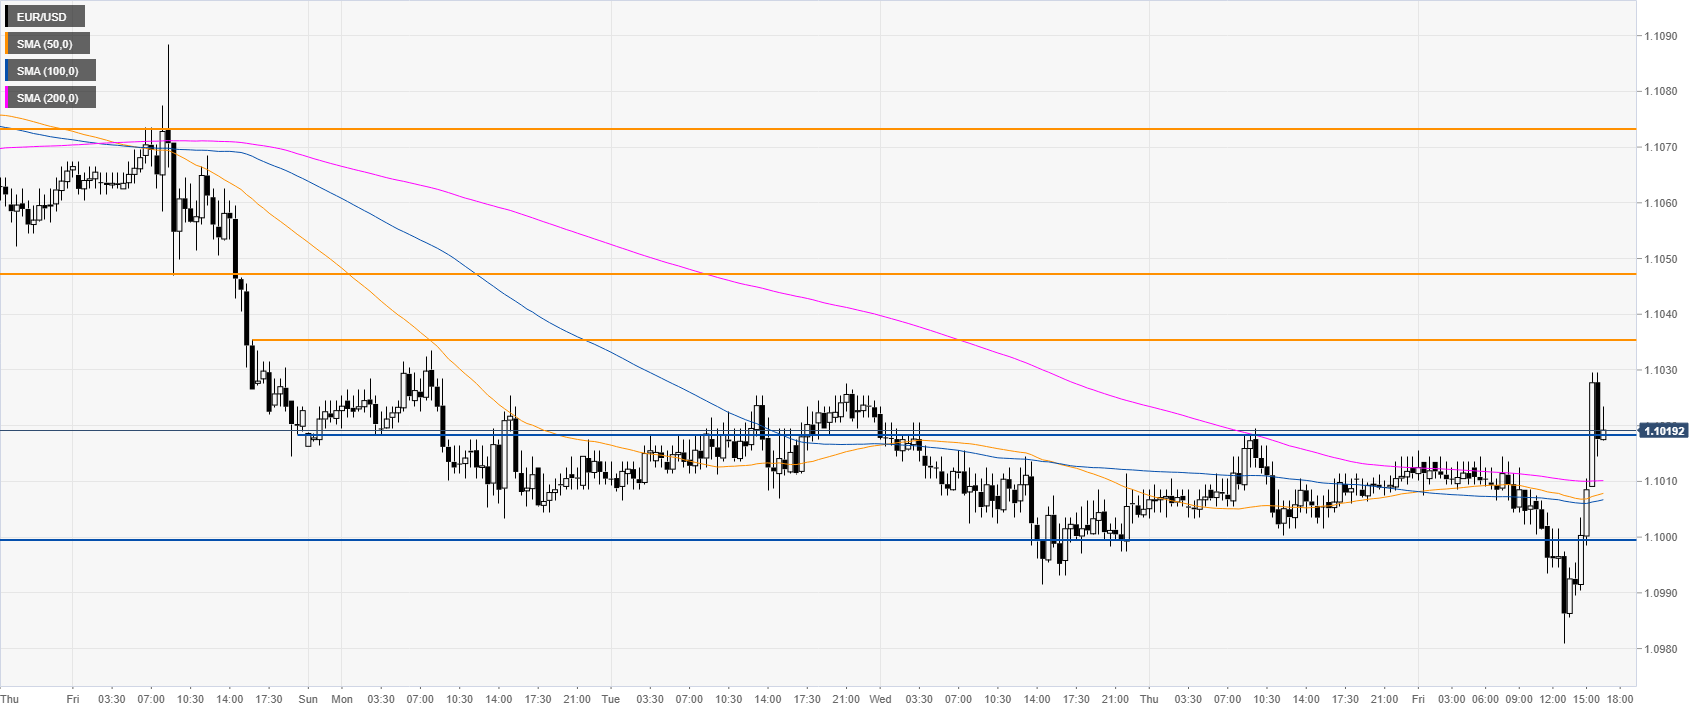
EUR/USD 30-minute chart
Although the weekly range was small, EUR/USD almost reversed the entire week in a matter of a couple of hours. The spot is trading back above the main SMAs, suggesting bullish momentum in the near term. Support can be seen at the 1.1020 level and 1.1000 handle.
Additional key levels