Back
5 Aug 2019
USD/CHF technical analysis: Swiss franc soars as the trade war worry investors
- Trade war tensions keep the demand for the Swiss franc high, sending USD/CHF down.
- The levels to beat for bears are at 0.9725 and 0.9695, according to the Technical Confluences Indicator.
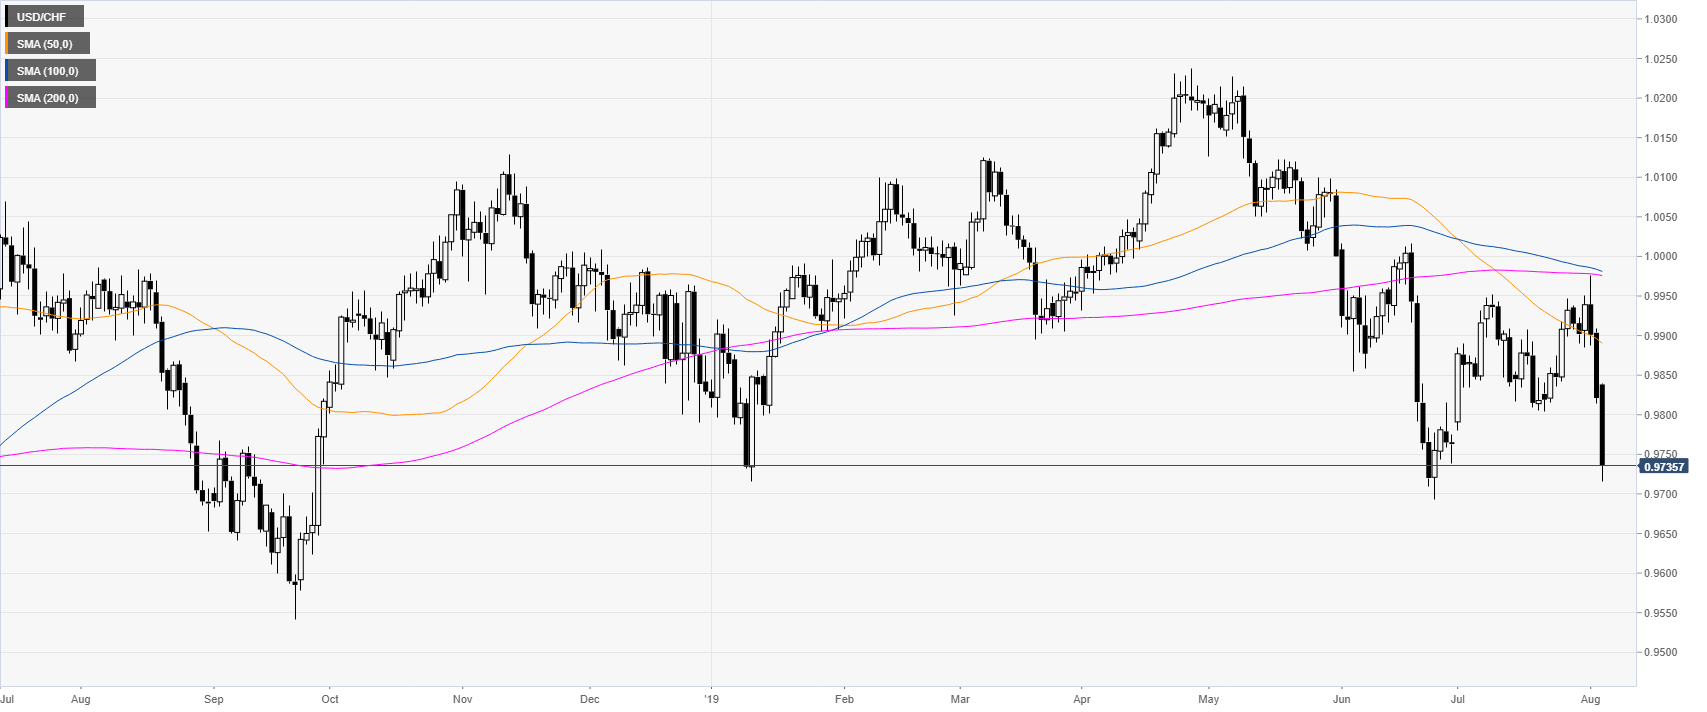
USD/CHF daily chart
USD/CHF is under intense selling pressure below its main daily simple moving averages (DSMAs). Investors are buying the Swiss franc as safe-haven as US stock indices are sharply down. In fact, the US-China trade war is sending a wave of panic across financial markets.
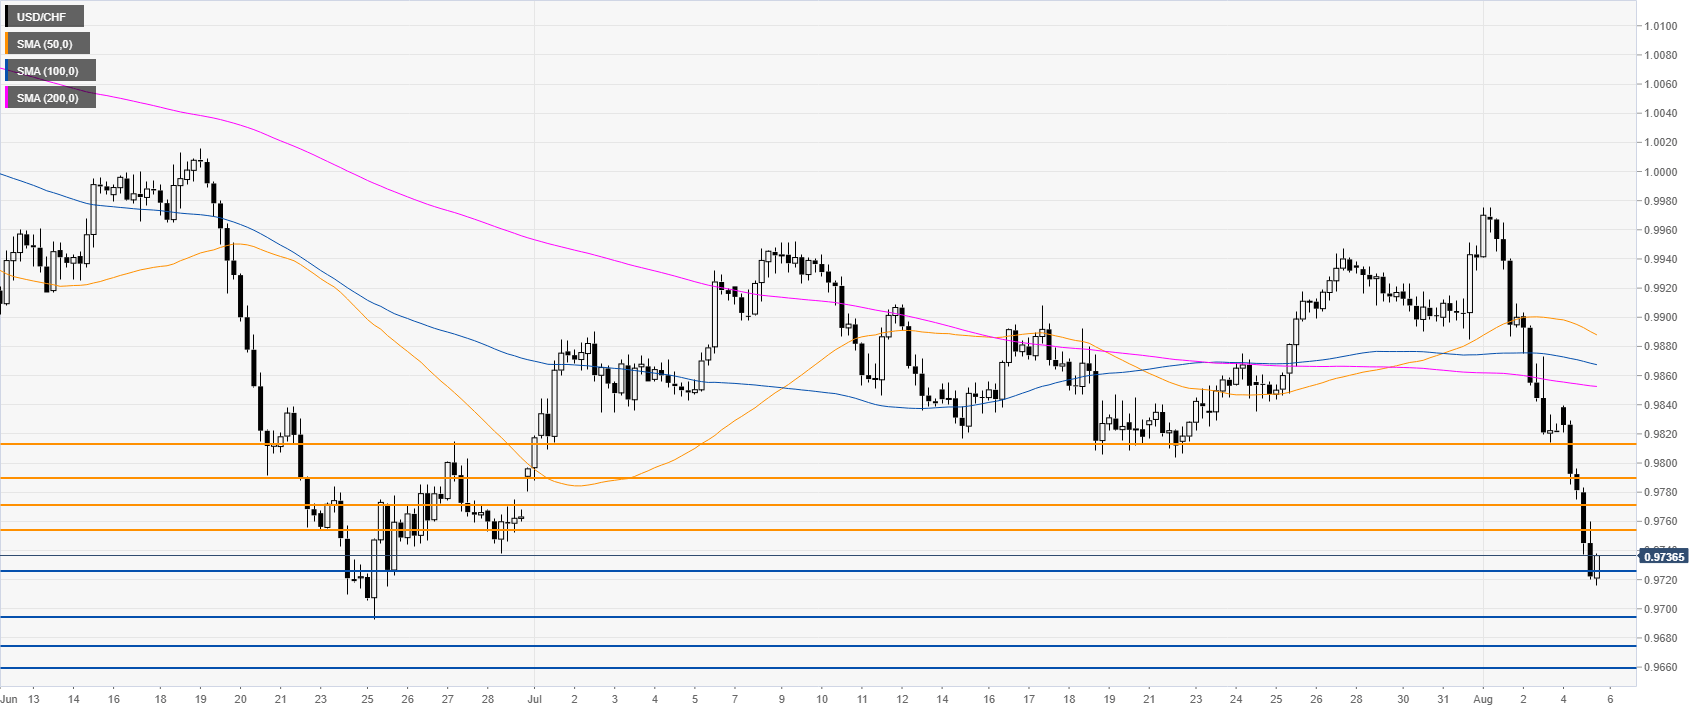
USD/CHF 4-hour chart
USD/CHF is falling below its main SMAs, suggesting strong bearish momentum in the medium term. The bears will most likely try to break below 0.9725 to reach 0.9695, 0.9675 and 0.9658 on the way down, according to the Technical Confluences Indicator.
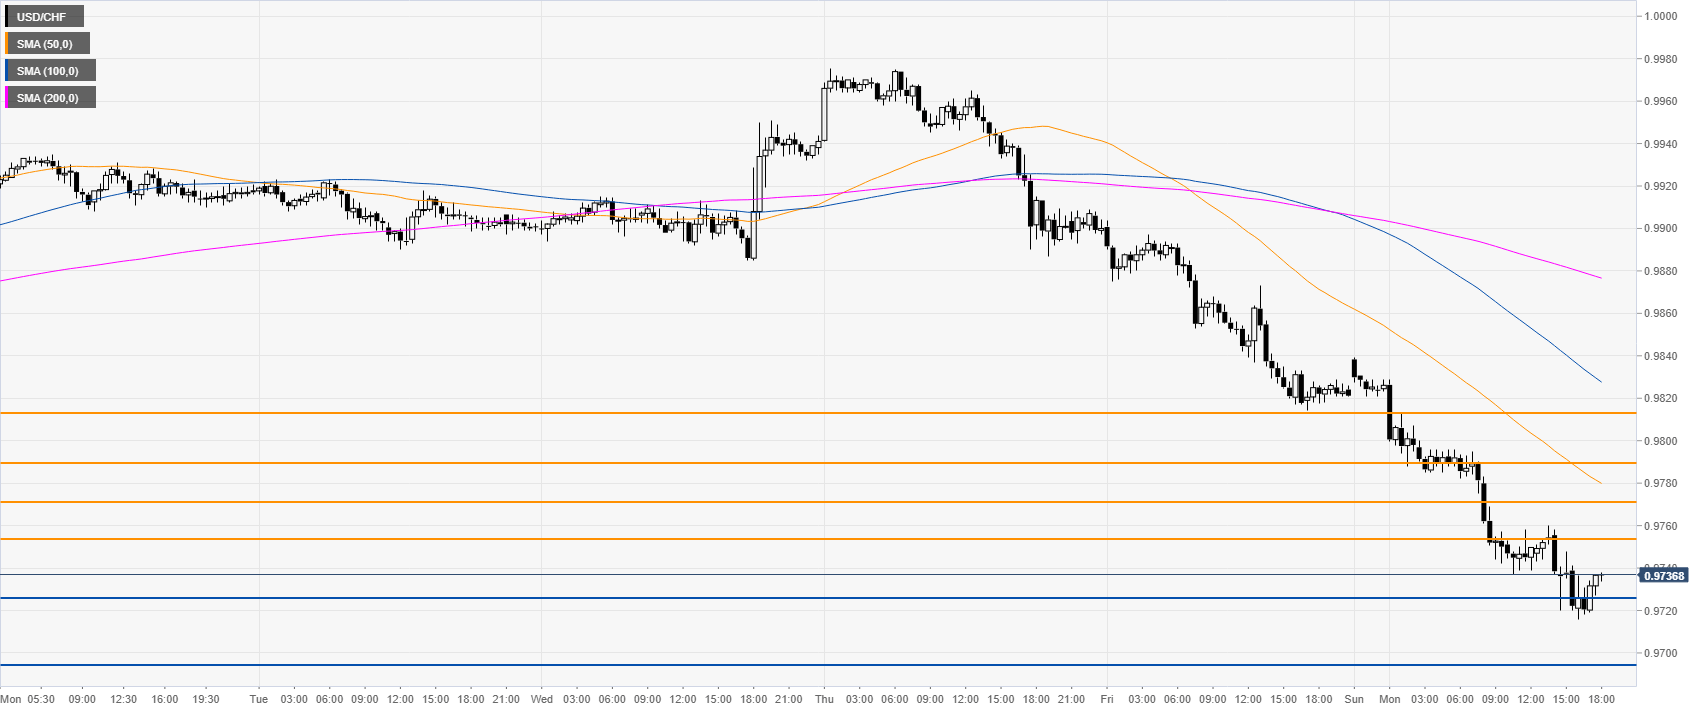
USD/CHF 30-minute chart
USD/CHF is trading in a bear trend below its main SMAs. Immediate resistances are near 0.9755 0.9770 0.9790 0.9815, according to the Technical Confluences Indicator.
Additional key levels