Back
21 Feb 2019
USD/INR Technical Analysis: 100-day MA is again reversing bounce
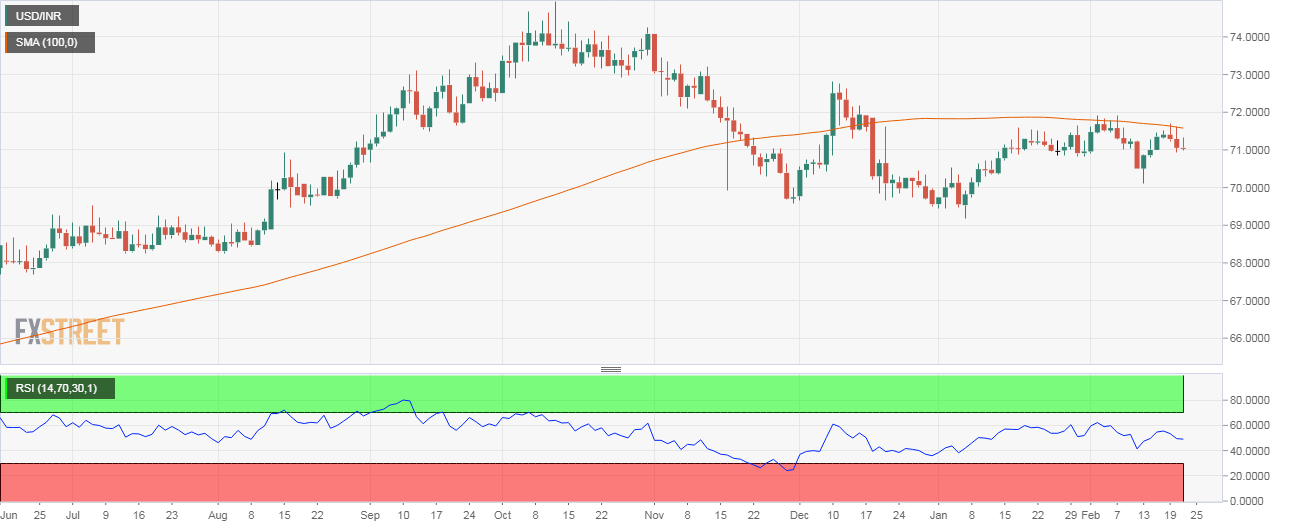
USD/INR is currently trading at 71.00, having failed to take out the 100-day moving average (MA) in the previous two days.
Daily chart

As seen above, the rally from Jan. 7 low of 69.185 ran out of steam at 100-day MA earlier this month and the repeated bull failure there was followed by a drop to 70.10 on Feb. 13.
The average is again proving a tough nut to crack. As noted earlier, the pair failed to close above the 100-day MA in the previous two days and is now feeling the pull of gravity.
The support at 70.50 could again come into play if the rejection at the 100-day MA fuels a break below the immediate support near 70.80.
A daily close above the 100-day MA is needed to strengthen the bull grip.
Trend: Bullish above 100-day MA
