Back
11 Feb 2019
Oil Technical Analysis: WTI declinining to $52.00 a barrel on Monday
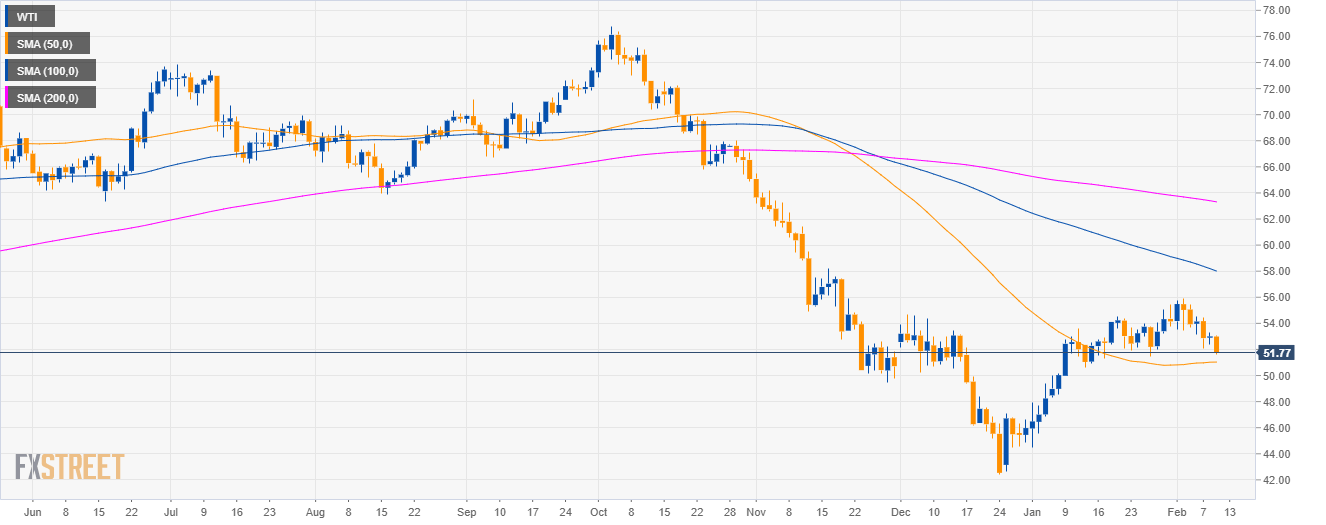
Oil daily chart
- Crude oil WTI is trading in a bear trend below its 200-day simple moving average.
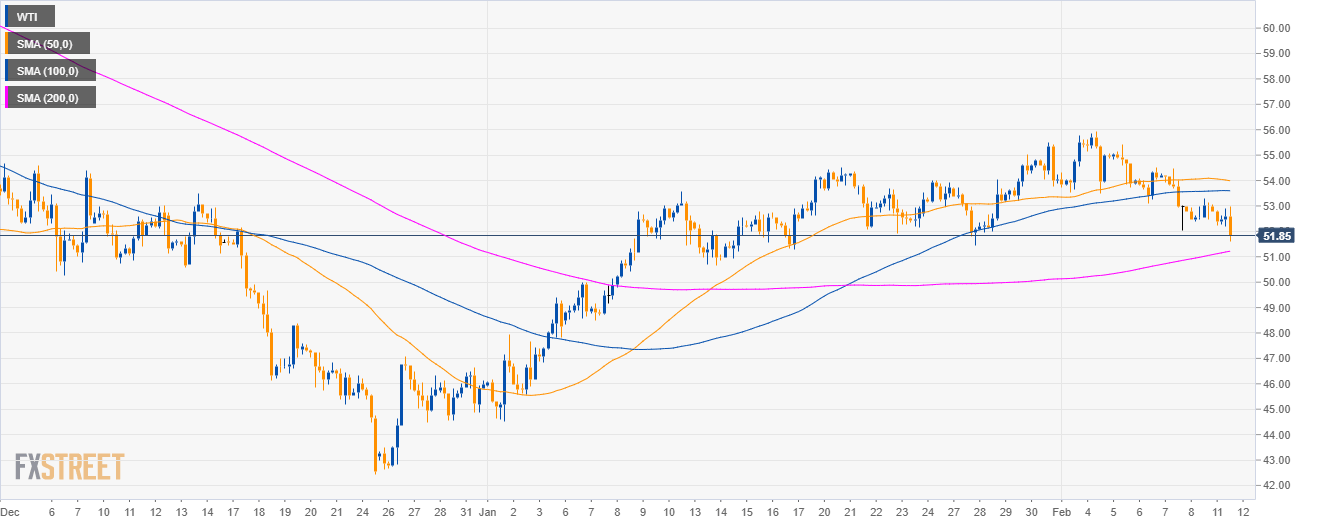
Oil 4-hour chart
- Crude oil is trading between the 100 and 200 SMA suggesting a sideways market in the medium-term.
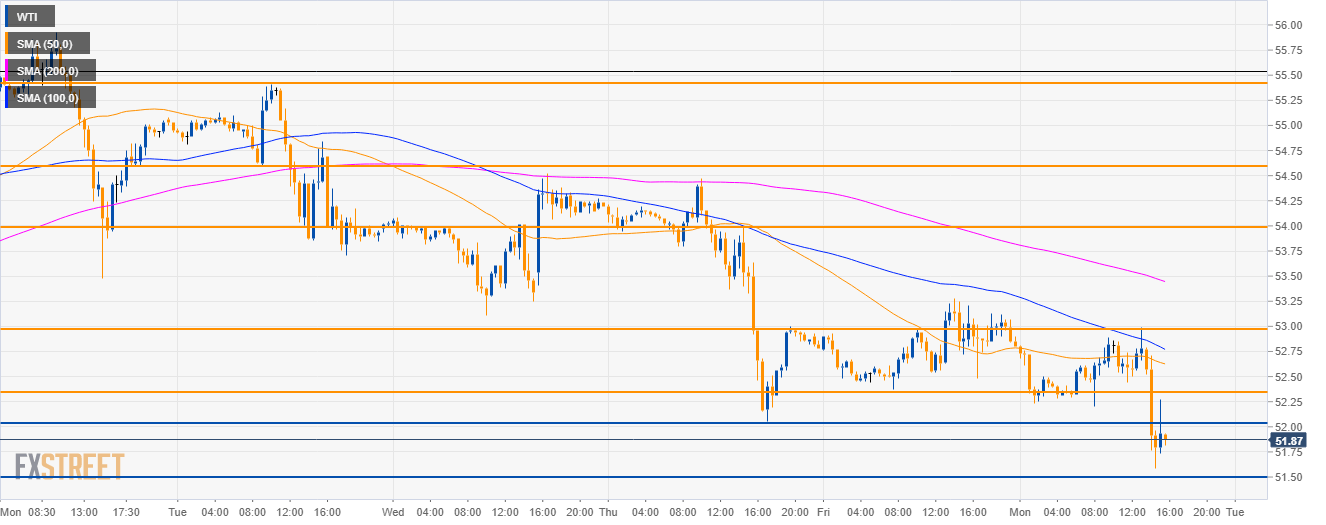
Oil 30-minute chart
- WTI is trading below the main SMAs suggesting bearish momentum in the short-term.
- On the way down, bears almost reached 51.50, their next objective will be to drive the market to 51.00 the figure.
- Resistance is seen at 52.30 and 53.00 figure.
Additional key levels
WTI
Overview:
Today Last Price: 51.93
Today Daily change %: -2.02%
Today Daily Open: 53
Trends:
Daily SMA20: 53.39
Daily SMA50: 51.04
Daily SMA100: 56.87
Daily SMA200: 63.15
Levels:
Previous Daily High: 53.28
Previous Daily Low: 52.37
Previous Weekly High: 55.93
Previous Weekly Low: 52.05
Previous Monthly High: 55.48
Previous Monthly Low: 44.52
Daily Fibonacci 38.2%: 52.93
Daily Fibonacci 61.8%: 52.72
Daily Pivot Point S1: 52.49
Daily Pivot Point S2: 51.97
Daily Pivot Point S3: 51.58
Daily Pivot Point R1: 53.4
Daily Pivot Point R2: 53.79
Daily Pivot Point R3: 54.31