Back
8 Feb 2019
WTI Technical Analysis: “Rising Wedge” breakout in place, initially targeting $51.10
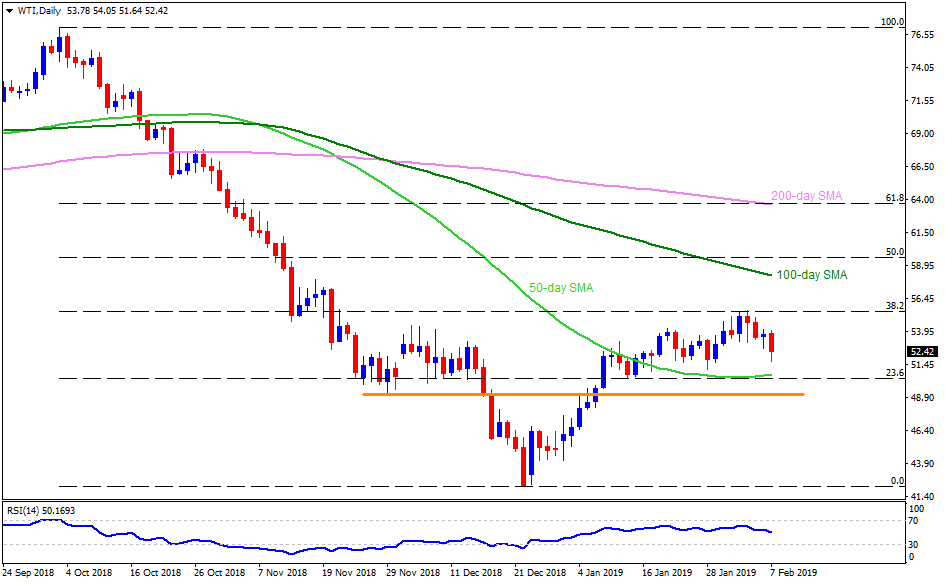
WTI daily chart
- Failure to surpass 38.2% Fibonacci Retracement of its October to December 2018 downturn highlights the importance of two-week low of $51.10, breaking which 50-day simple moving average (SMA) figure of $50.60 can gain market attention.
- In case prices refrain to respect $50.60 level, the $50.00 mark and the $49.10-$49.00 horizontal-area may become next support to watch.
- On the upside, a closing break of $55.45, comprising 38.2% Fibonacci, could accelerate the upmoves to 100-day SMA level of $58.20.

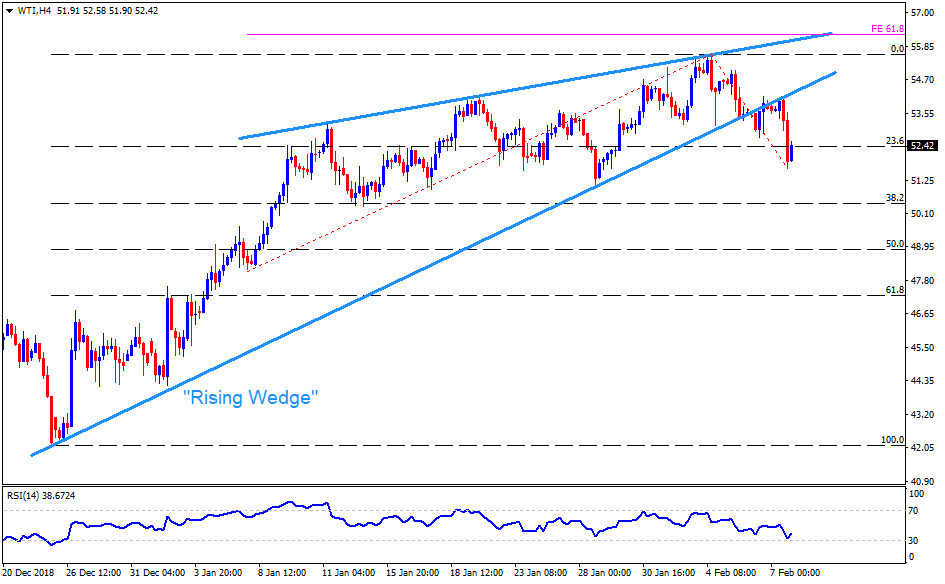
WTI 4-hour chart
- “Rising Wedge” break signals further declines of the WTI.
- It can take rest at $51.10 initially to confirm further declines to $50.60 and the $50.30 supports.
- Alternatively, $54.15 and $55.00 are likely nearby resistances to watch before highlighting $55.45 upside barrier.

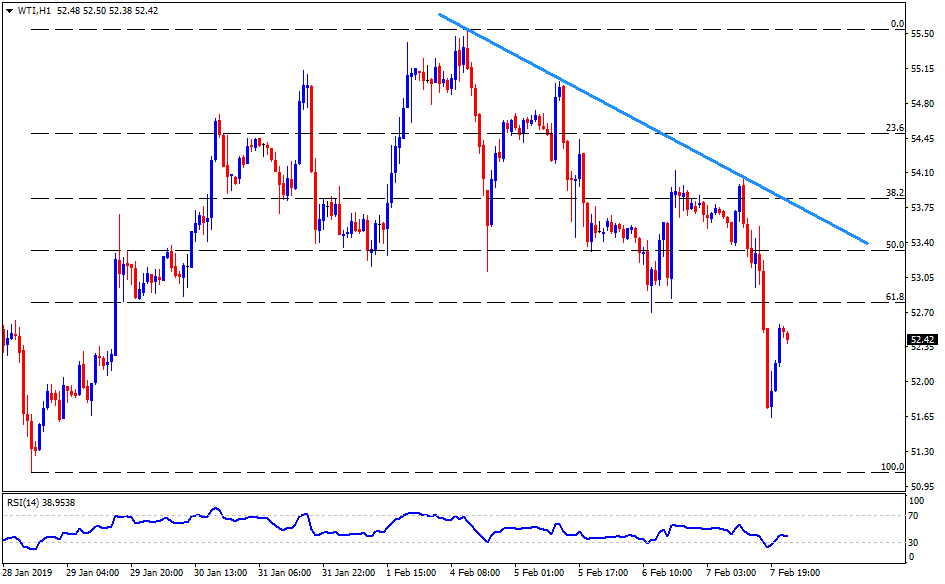
WTI Hourly chart
- Inability to sustain recent pullback past-$52.60 portrays the weakness.
- $51.60 becomes a small halt prior to visiting the low of $51.10.
- Meanwhile, a break of $52.60 can have $53.15 and a downward sloping trend-line at $53.85 as nearby resistances to watch.

