Back
10 Aug 2018
EUR/USD Technical Analysis: Sell-off now targets sub-1.1400 levels
- Spot has quickly left behind the key support at 1.1500 the figure today, accelerating the decline and testing fresh 2018 lows in the 1.1430 region.
- The persistent leg lower has now prompted investors to shift their focus to the area of 1.1310, where sits June’s 2017 low.
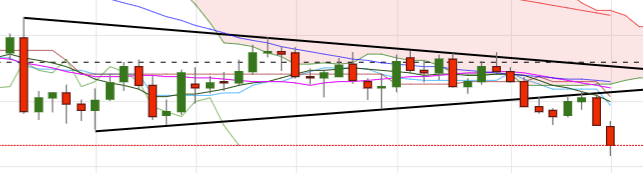
- Looking at the broader picture in the daily chart, the pair has resumed the downside following April-May drop, seconded by a brief consolidation (June-July) and then breaking below the pennant figure (continuation pattern).
- On the upside, occasional bullish attempts should meet interim hurdle at the 10-day SMA at 1.1597, while the area of recent tops above 1.1600 the figure appears as a more significant resistance. This area is also reinforced by the 21-day SMA (1.1640) and the bottom of the pennant pattern (resistance line now).
- Furthermore, the offered stance should remain unchanged as long as the 1.1745/50 band caps.
EUR/USD daily chart
Daily high: 1.1537
Daily low: 1.1432
Support Levels
S1: 1.1495
S2: 1.1463
S3: 1.1401
Resistance Levels
R1: 1.1589
R2: 1.1652
R3: 1.1684