Back
9 Aug 2018
GBP/USD Technical Analysis: new lows for 2018 as traders await UK GDP on Friday
- A catatonic Sterling slumps to a new 12-month low, bears seeking out 2017 lows as Brexit and a dovish BoE continue to weigh on the GBP.
- A thin calendar for Thursday sees Pound traders awaiting Friday's UK GDP figures.
- The GBP/USD is on pace to close in the red for a fifth straight week.
GBP/USD Chart, 15-Minutes
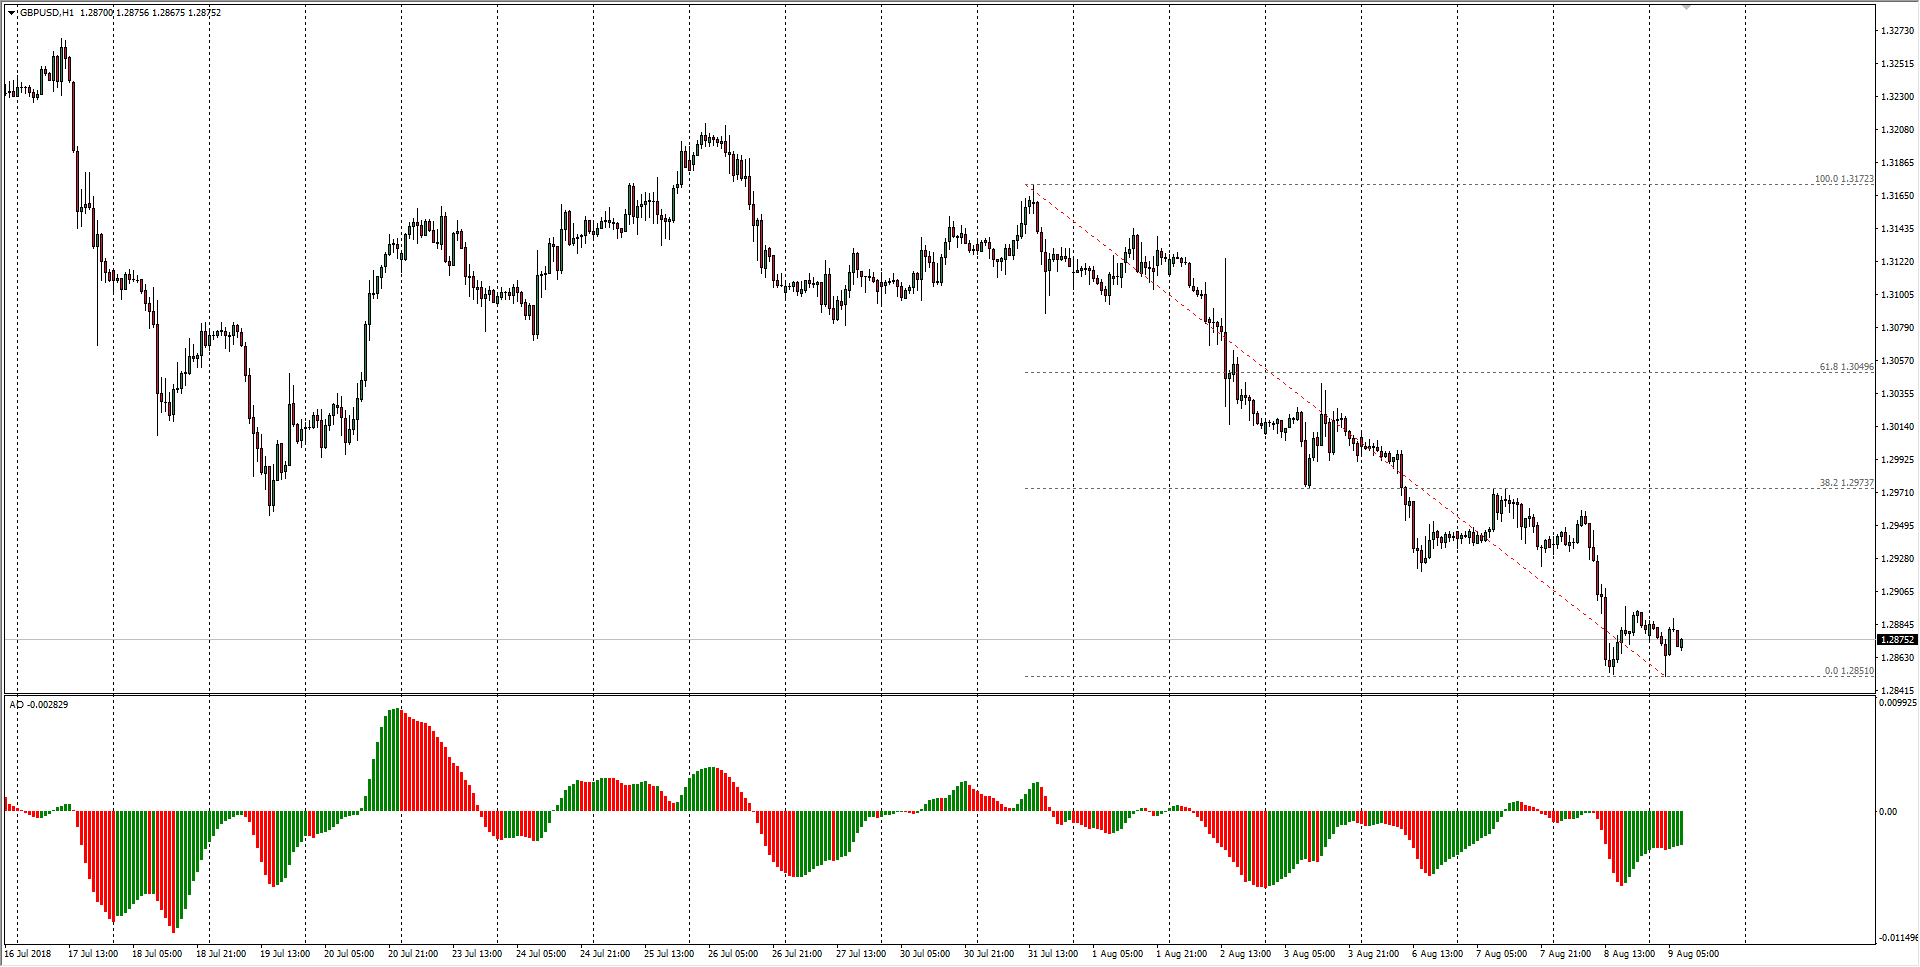
| Spot rate: | 1.2875 |
| Relative change: | Negligible |
| High: | 1.2888 |
| Low: | 1.2851 |
| Trend: | Bearish |
| Support 1: | 1.2851 (major technical bottom; 12-month low) |
| Support 2: | 1.2791 (S2 daily pivot) |
| Support 3: | 1.2773 (August 2017 swing low) |
| Resistance 1: | 1.2973 (38.2% Fibo retracement level) |
| Resistance 2: | 1.3010 (current week high) |
| Resistance 3: | 1.3172 (previous week high) |