Mengonfirmasi Anda bukan dari AS atau Filipina

Dengan memberikan pernyataan ini, saya secara tegas menyatakan dan mengonfirmasikan bahwa:
  • Saya bukan warga negara atau penduduk AS
  • Saya bukan penduduk Filipina
  • Saya, secara langsung maupun tidak langsung, tidak memiliki lebih dari 10% saham/hak suara/kepentingan dari penduduk AS dan/atau tidak mengontrol warga negara atau penduduk AS dengan cara lain
  • Saya tidak berada di bawah kepemilikan langsung atau tidak langsung untuk lebih dari 10% saham/hak suara/kepentingan dan/atau berada di bawah kontrol warga negara atau penduduk AS dengan cara lain
  • Saya tidak berafiliasi dengan warga negara atau penduduk AS dalam hal Bagian 1504(a) dari FATCA
  • Saya menyadari tanggung jawab saya jika membuat pernyataan palsu.
Untuk tujuan pernyataan ini, semua negara dan wilayah dependen AS disamakan dengan wilayah utama AS. Saya berkomitmen untuk membela dan membebaskan Octa Markets Incorporated, direktur dan pejabatnya dari klaim apa pun yang timbul akibat atau terkait dengan pelanggaran apa pun atas pernyataan saya.
Kami berkomitmen menjaga privasi dan keamanan informasi pribadi Anda. Kami hanya mengumpulkan email untuk menyediakan penawaran khusus dan informasi penting tentang produk dan layanan kami. Dengan memberikan alamat email, Anda setuju untuk menerima surat tersebut dari kami. Jika Anda ingin berhenti berlangganan atau memiliki pertanyaan maupun permasalahan, silakan hubungi Layanan Pelanggan kami.
Octa trading broker
Buka akun trading
Back

USD/CAD Price Forecast: Hitting resistance zone at top of multi-year range

  • USD/CAD rallies up to a zone of resistance from historic highs at the top of a long-term range. 
  • The pair’s strong rally could begin to wane in the face of the firm resistance. 
  • There are no signs yet of a reversal lower, however, and the short and medium-term trends remain “up”.

USD/CAD reaches the top of a multi-year range and it is probable the pair will meet stiff technical resistance at these levels.

USD/CAD Daily Chart
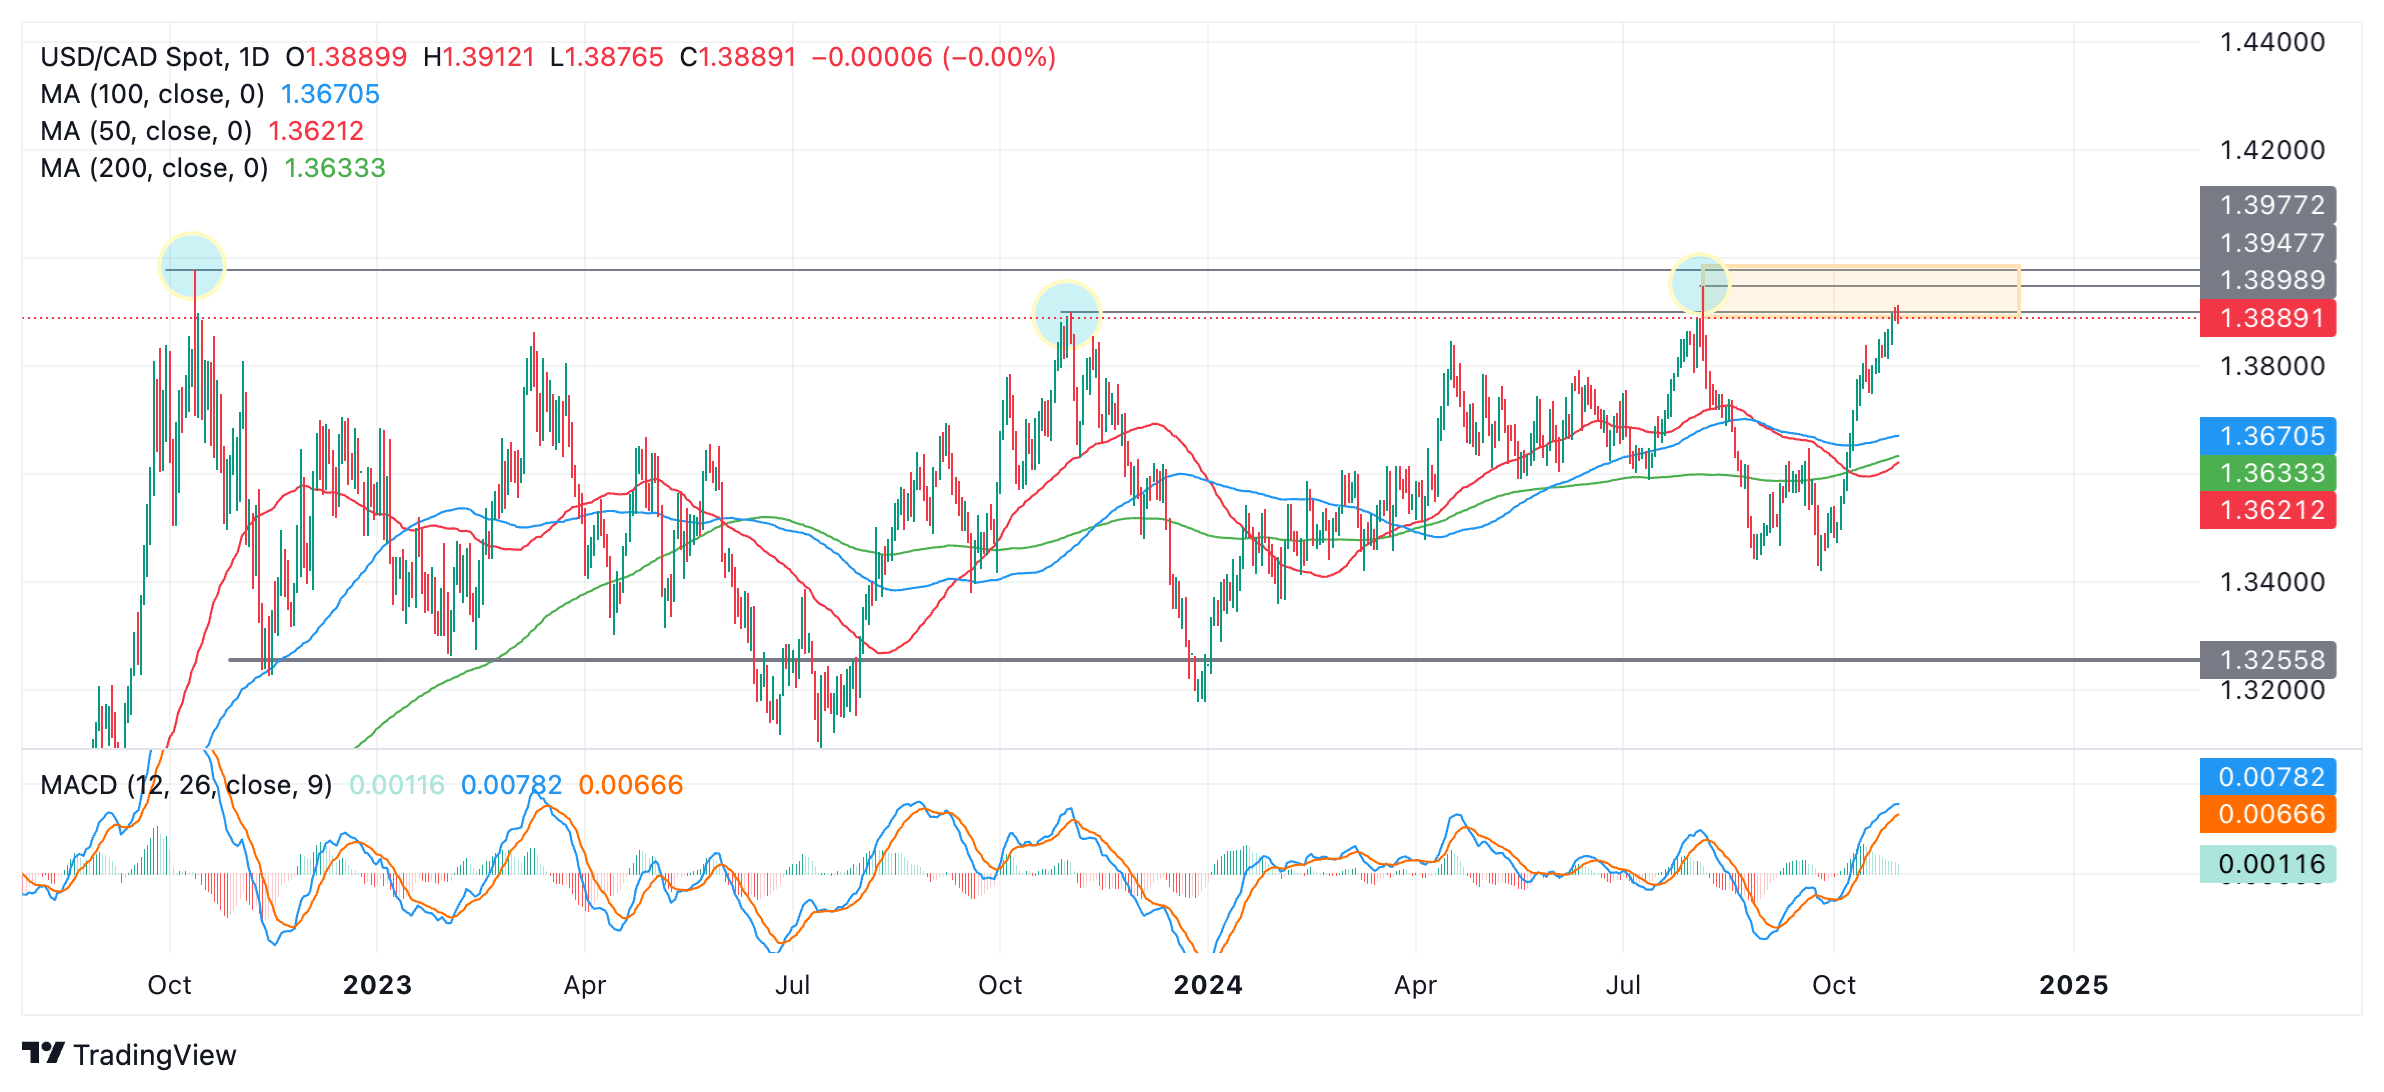
USD/CAD has reached a zone (orange shaded rectangle) in the 1.3800s and 1.3900s composed of resistance from historic highs. These include the August 2024 high, the November 2023 high and the October 2022 high. The peaks have been highlighted with blue circles in the chart above. They comprise the top of the pair’s long-term sideways range. 

It is possible this may mark a turning point for USD/CAD and price will roll over and begin a leg down within its range, however, there are no signs yet from price confirming this. Although the pair has formed two Doji Star Japanese candlesticks in a row over the last two days (so far), it would require a long bearish candle to confirm that these formed part of a reversal pattern. Such a down day has not yet materialized. 

The short and medium-term trends remain bullish and given the principle that “the trend is your friend” the odds are tilted in favor of more upside. As such, USD/CAD could still go higher to the very top of the range at 1.3977. 

The Moving Average Convergence Divergence (MACD) momentum indicator is at relatively high levels and is bending over. It looks like it might cross below the red signal line giving a sell signal – but that has not happened yet. If it does, it will be further evidence of a bearish reversal. 


Silver Price Forecast: XAG/USD rallies to near $34.50 after weak US Job Openings data

Silver price (XAG/USD) discovers strong buying interest in Tuesday’s North American session as the United States (US) Bureau of Labor Statistics (BLS) has reported weak set of JOLTS Job Openings data for September.
Baca selengkapnya Previous

Oil: Set-up for a tactical rebound is strengthening – TDS

Energy supply risk premia continues to melt out of crude oil prices, but the set-up for a tactical rebound is strengthening, TDS’ Senior Commodity Strategist Daniel Ghali notes.
Baca selengkapnya Next