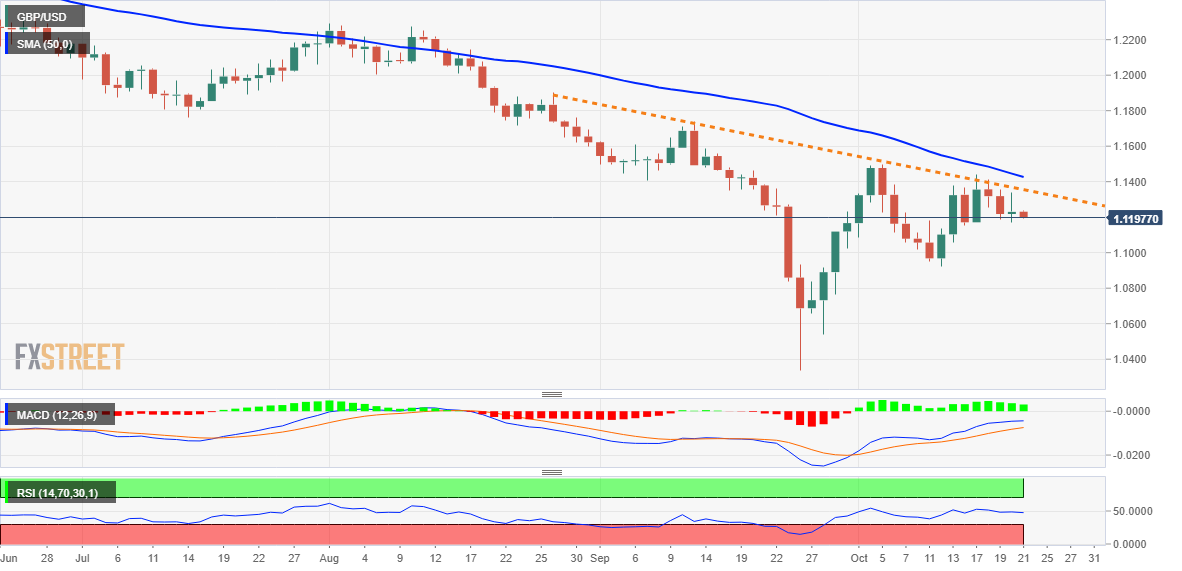
GBP/USD Price Analysis: Struggles near weekly low, seems vulnerable below 1.1200 mark
- GBP/USD meets with a fresh supply on Friday and is pressured by a modest USD strength.
- The overnight rejection near a two-month-old descending trendline favours bearish traders.
- Weakness below the weekly low is needed to support prospects for further near-term losses.
The GBP/USD pair edges lower during the Asian session on Friday and is currently trading around the 1.1200 mark, just a few pips above the weekly low touched the previous day.
The US dollar regains some positive traction amid the continuous rise in the US Treasury bond yields, bolstered by expectations that the Fed will continue to hike interest rates at a faster pace. Apart from this, a generally weaker risk tone offers additional support to the safe-haven buck, which, in turn, is seen exerting some pressure on the GBP/USD pair.
Spot prices did get a minor lift on Thursday after Liz Truss said that she will resign as the UK's Prime Minister. The momentum, however, faltered ahead of a downward sloping trend-line resistance extending from late August. The subsequent pullback favours bearish traders and supports prospects for a further near-term depreciating move for the GBP/USD pair.
That said, technical indicators on the daily chart are yet to confirm a bearish bias and warrant some caution. Hence, it will be prudent to wait for some follow-through selling below the overnight swing low, around the 1.1170 area, before positioning for any further depreciating move. The GBP/USD pair might then accelerate the fall towards testing the 1.1100 mark.
The downward trajectory could further get extended towards the next relevant support near the 1.1055-1.1050 support zone. The GBP/USD pair could eventually drop to the 1.1000 psychological mark, which if broken decisively will be seen as a fresh trigger for bearish traders.
On the flip side, the 1.1250-1.1260 region now seems to act as an immediate strong resistance, above which a bout of a short-covering should allow the GBP/USD pair to reclaim the 1.1300 mark. Any subsequent move up, however, might continue to confront stiff resistance near the aforementioned trend line, which is currently pegged near the 1.1350-1.1355 region.
A convincing breakthrough will negate any near-term negative bias and pave the way for additional gains. The momentum could then lift the GBP/USD pair towards the 1.1400 mark en route to the weekly high, around the 1.1440 region. The latter coincides with the 50-day SMA, which should act as a pivotal point and help determine the next leg of a directional move.
GBP/USD daily chart
Key levels to watch